
Token and cost statistics
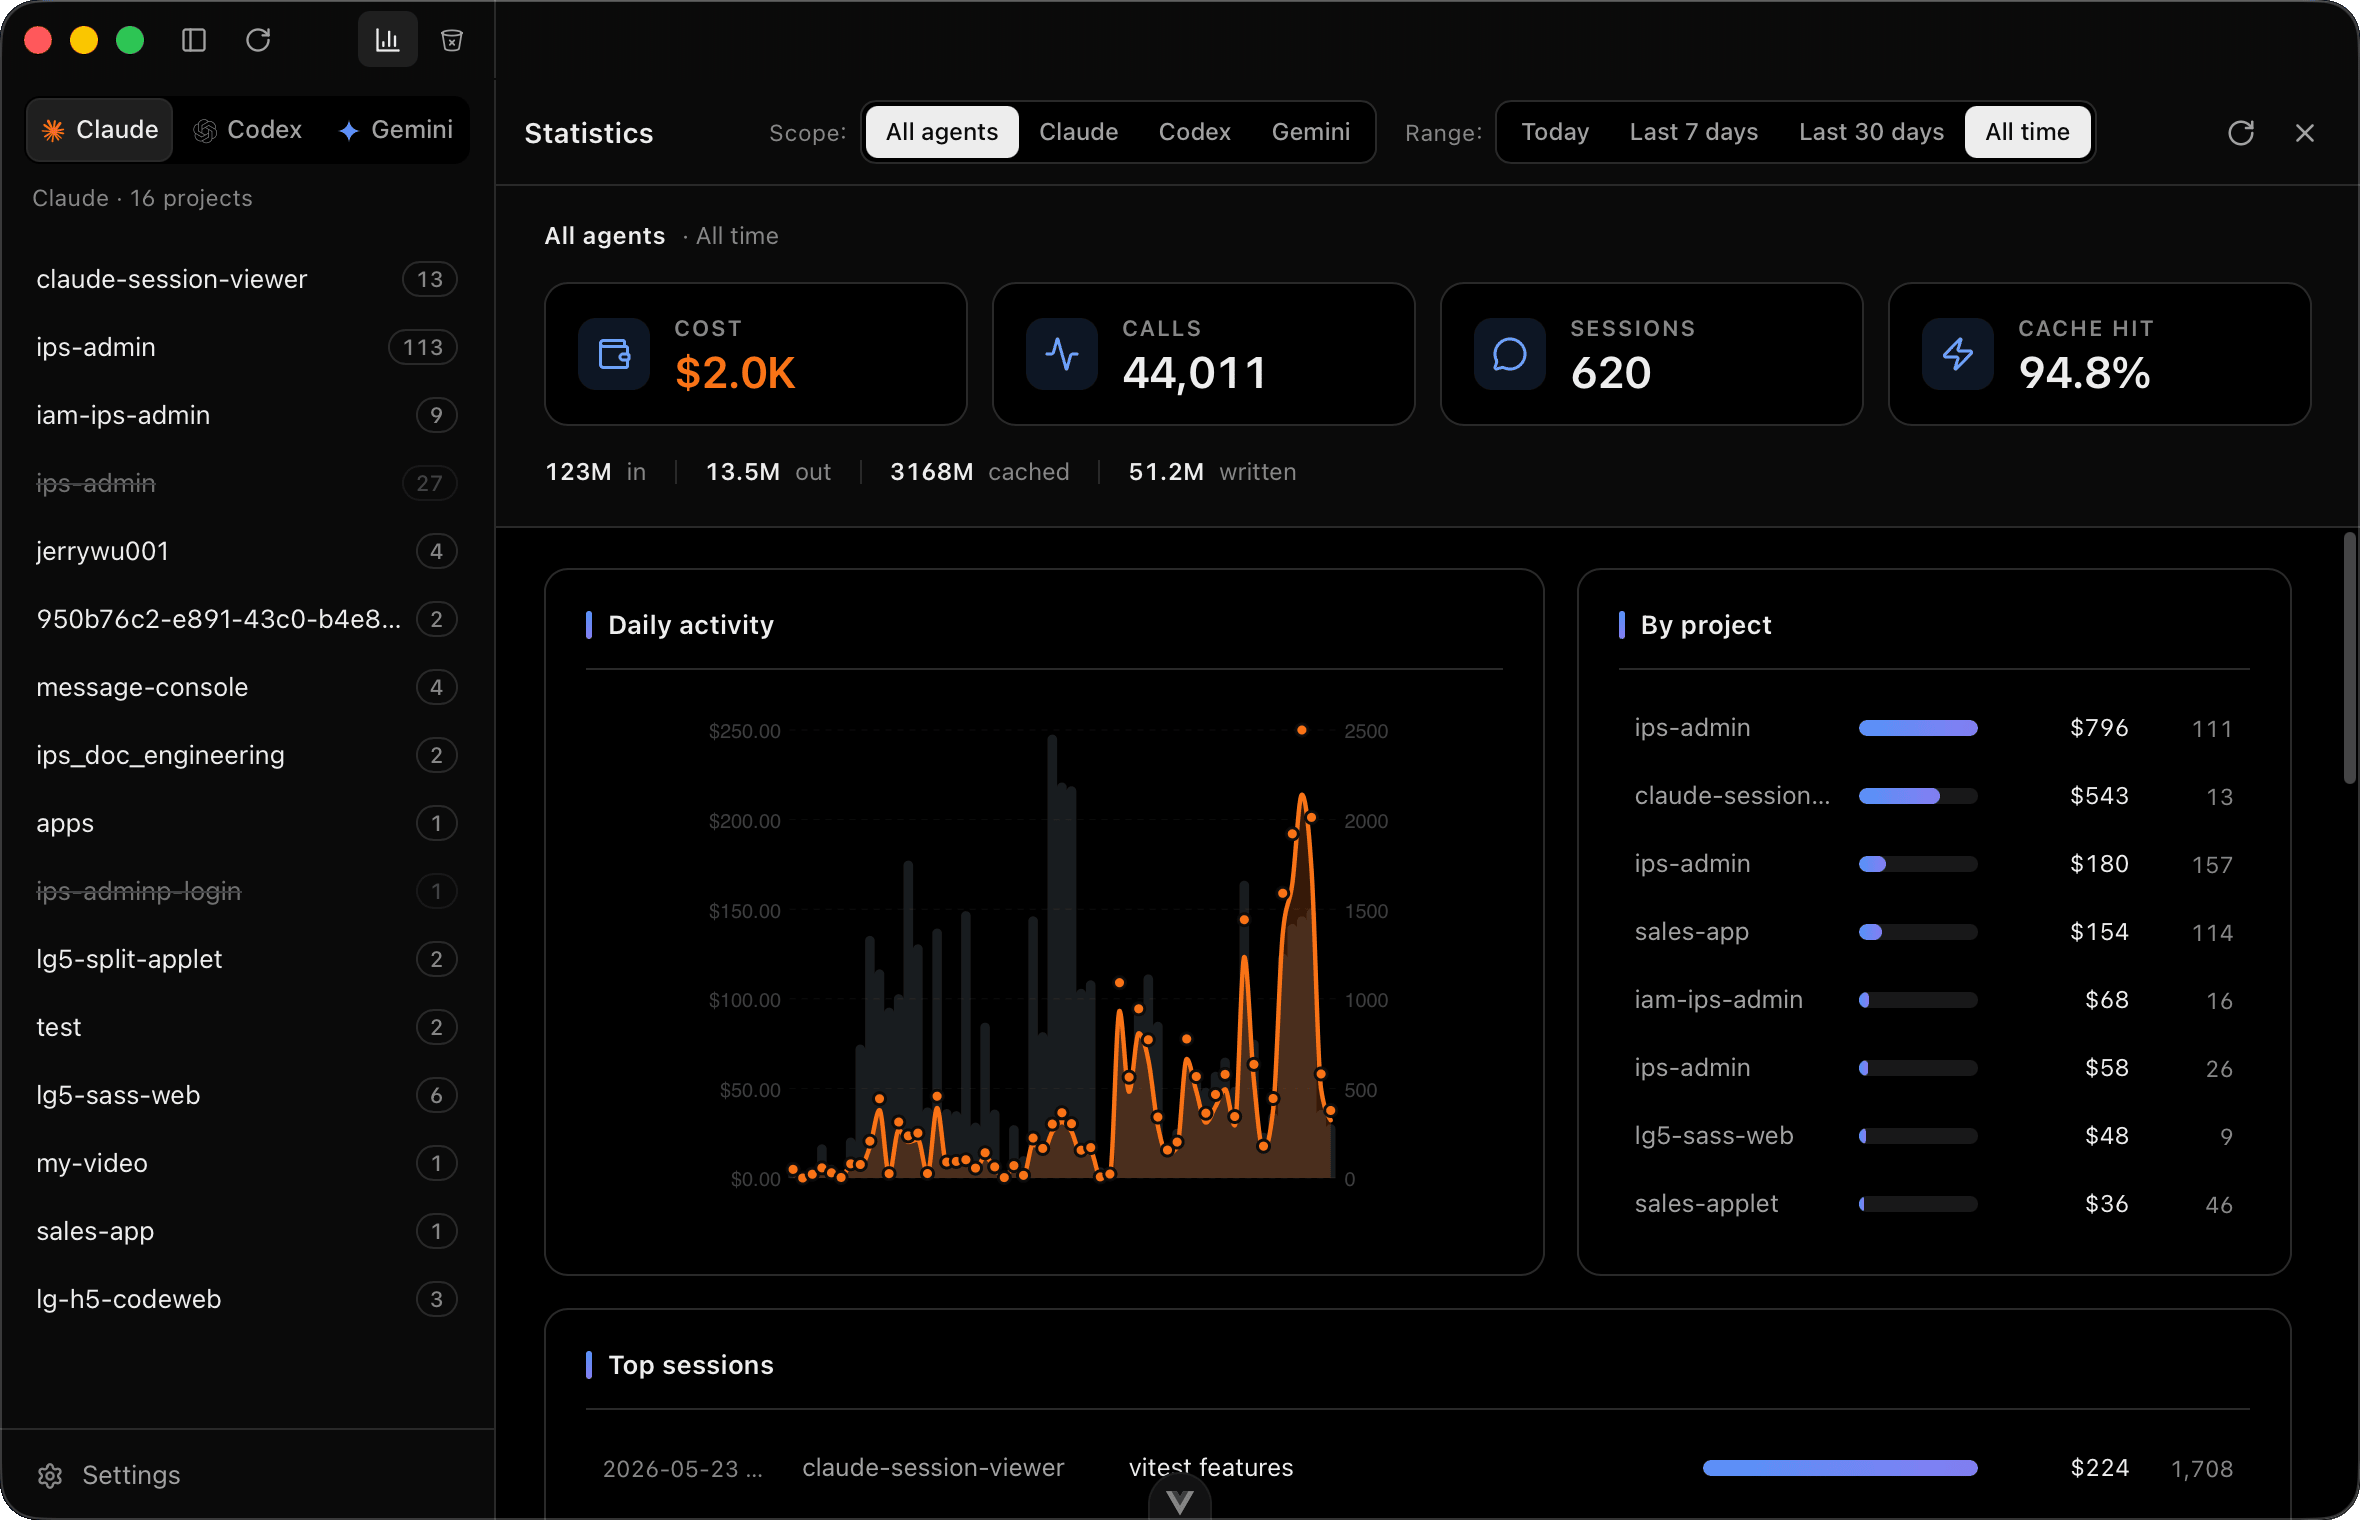
Every agent reports token usage somewhere in its transcript, and none of them show you the total across all of them. ⌘⇧S opens the statistics view, which reads every session on disk and adds it up.
What it breaks down by
- Project: which repository is actually costing you money
- Model: where the spend sits across the models you use
- Tool: which tools get called, and how often
- Time: today, the last 7 days, the last 30 days
Scope it to all agents at once or to one in particular.
Where the prices come from
Prices come from models.dev, an open model catalogue, and are cached locally for 24 hours.
models.dev was chosen over LiteLLM's price table because of release lag. That table is updated by pull request, so a newly released model can go days without an entry. Fable 5 was in models.dev on launch day and not in LiteLLM. A missing entry means a session that silently costs nothing in the totals, which is worse than a slightly stale price.
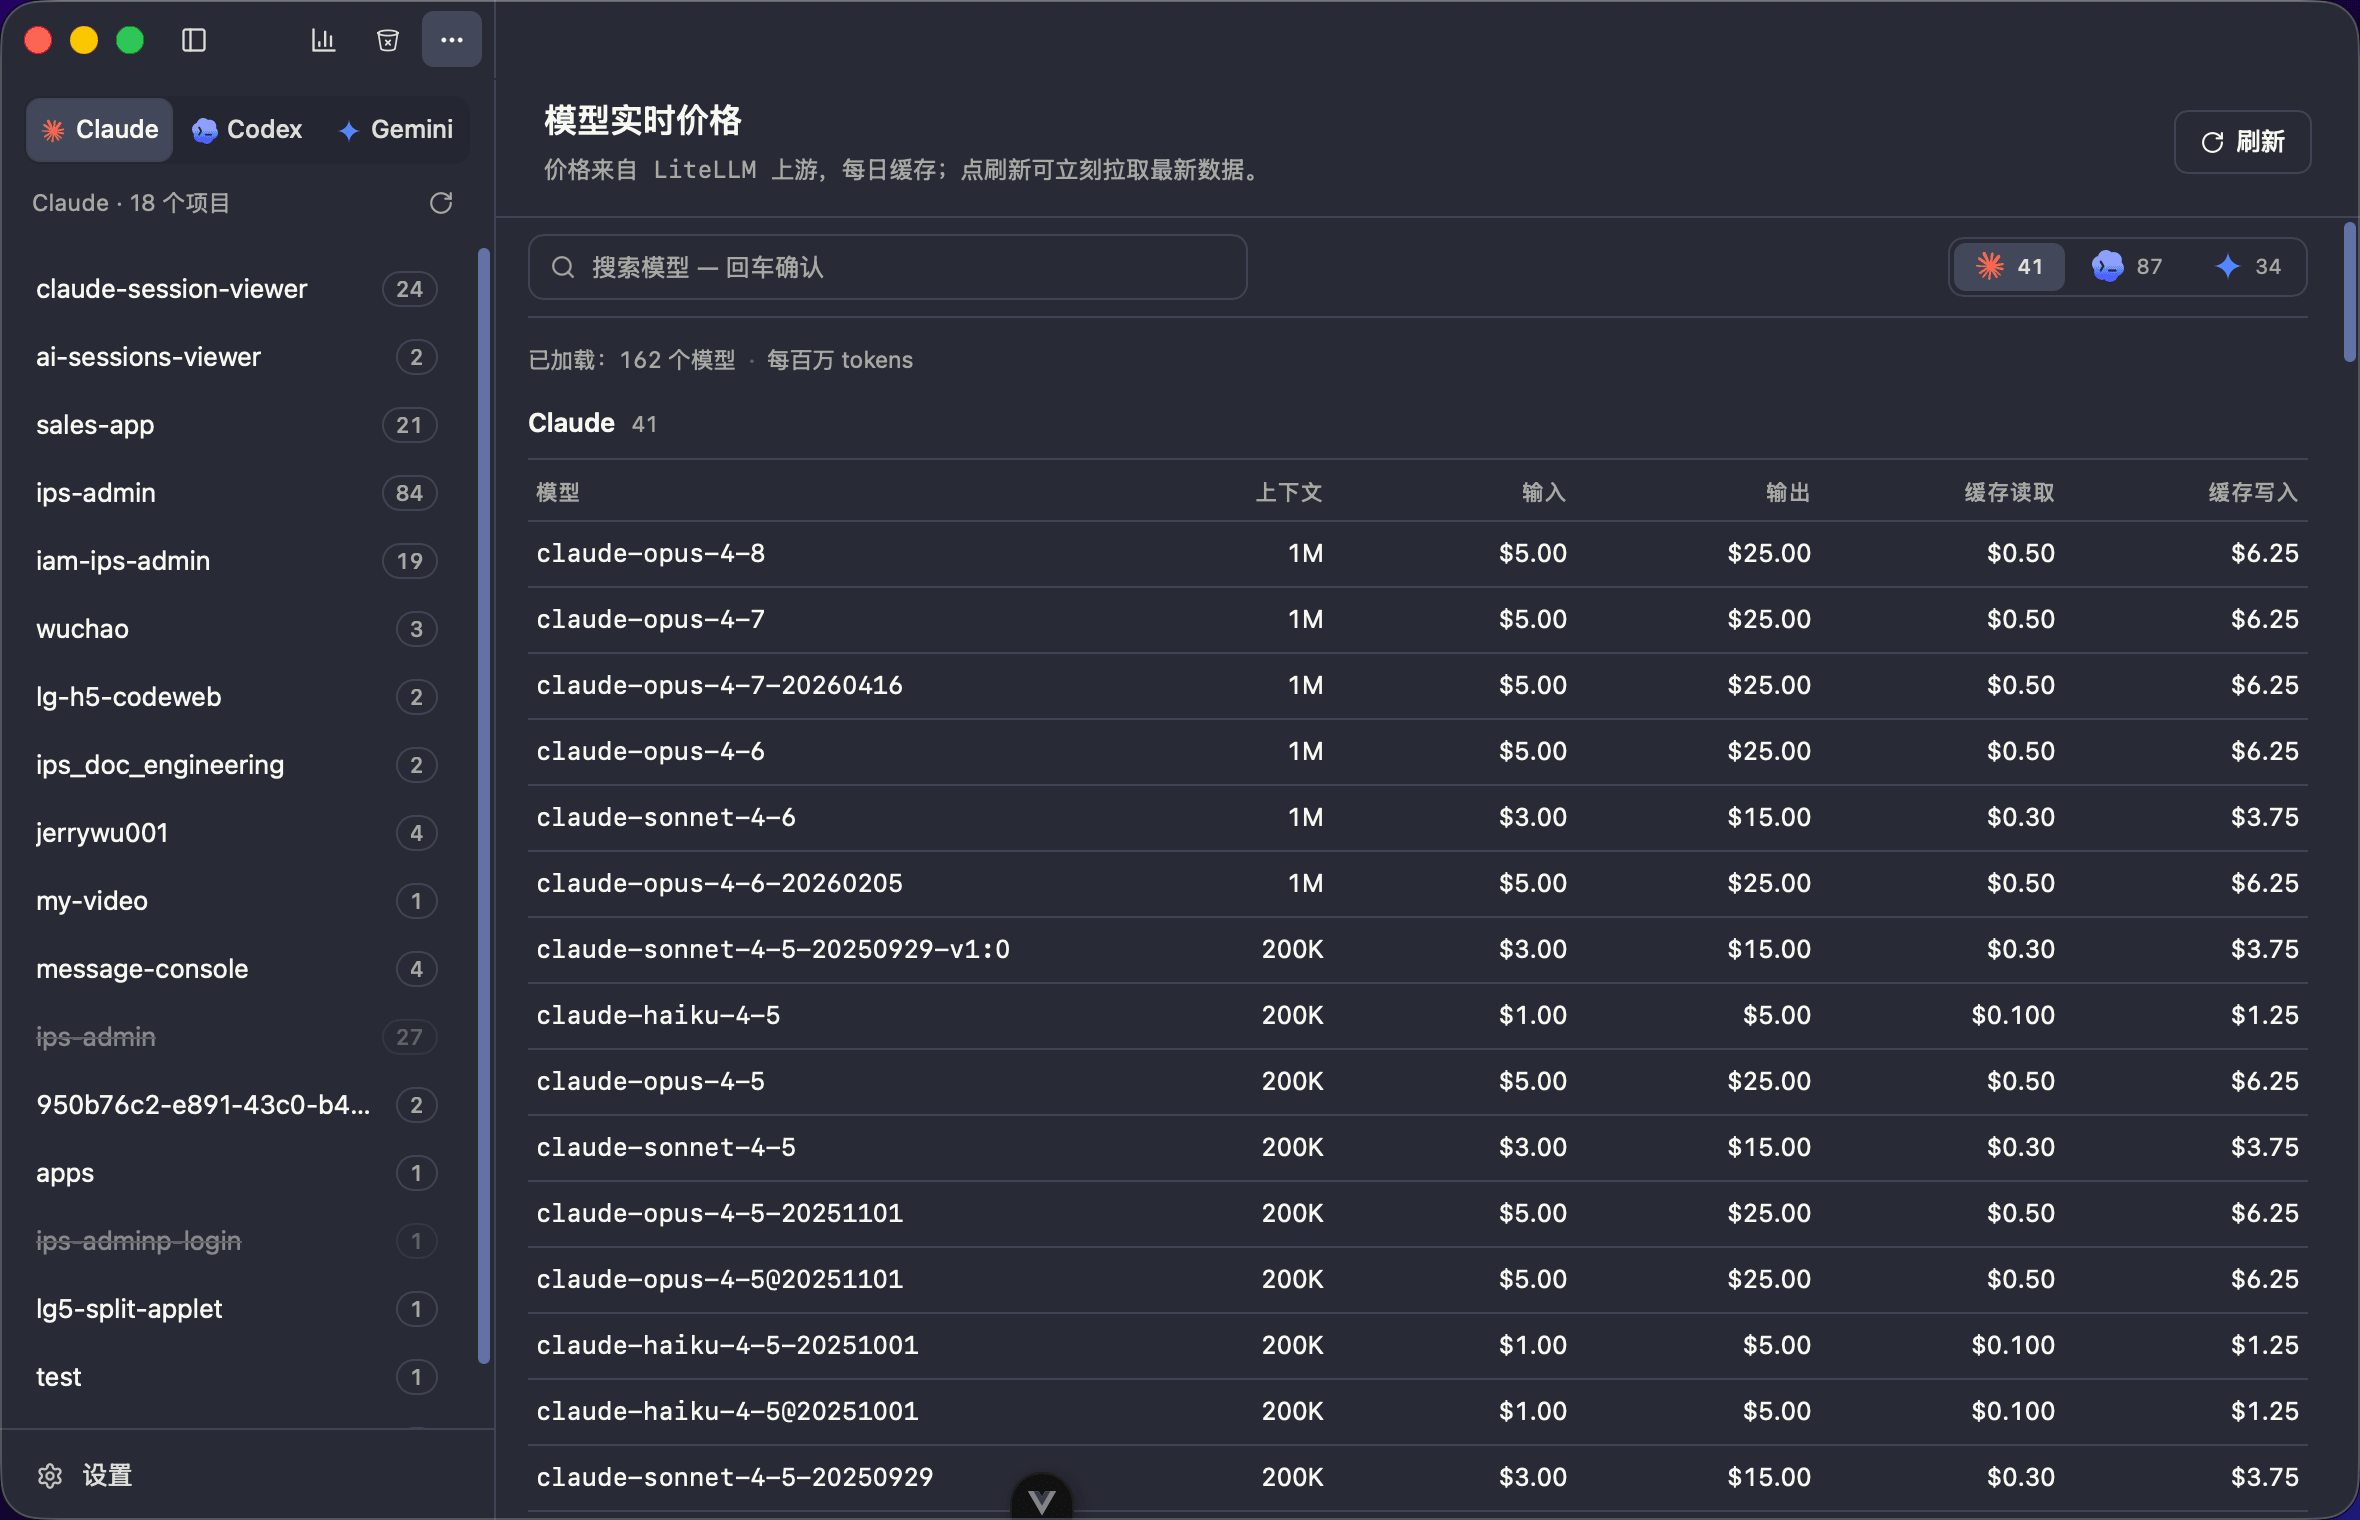
The full price table is browsable in the app, so you can see what a model is being costed at instead of trusting a number with no provenance.
Where a price table is not enough
opencode can be pointed at any provider, so a model name does not determine a price. For those sessions the cost recorded per message in opencode's own database is used instead. See the opencode page. Antigravity CLI records no token fields at all, so it contributes no usage figures.
In the menu bar
On macOS the menu bar shows today, 7-day and 30-day totals per agent, so the number is somewhere you will actually see it instead of behind a window you have to open.
Quota badges
Claude and Codex sessions with a subscription login show the 5-hour and weekly quota remaining next to the composer, refreshed as you work. Sessions authenticated with a third-party API key have no such window, so no badge appears.